Your ROAS says you're growing. Does your P&L agree?
Clicksi partners with D2C brands generating ₹10 lakh+ in monthly revenue and investing ₹2 lakh+ a month in Meta.
We measure growth where it actually happens, in new customer MER, contribution margin and CAC payback, then build the creative, account structure and testing roadmap to scale it.
For D2C brands with ₹10L+ monthly revenue and a minimum Meta ad spend of ₹2L/month.
Questions most D2C brands at ₹10L+ monthly revenue cannot answer with confidence.
Acquisition quality
Unit economics
Scalability
Content That Worked
Performance marketing managed against your P&L.
We operate across your ad account, store backend and margin structure as one system. Each engagement includes:
Measurement architecture.
Meta acquisition strategy.
Creative strategy and testing system.
Signal and data integrity.
Incrementality programme.
Offer and conversion optimisation.
Budget and scaling governance.
Executive reporting.
Results and proof
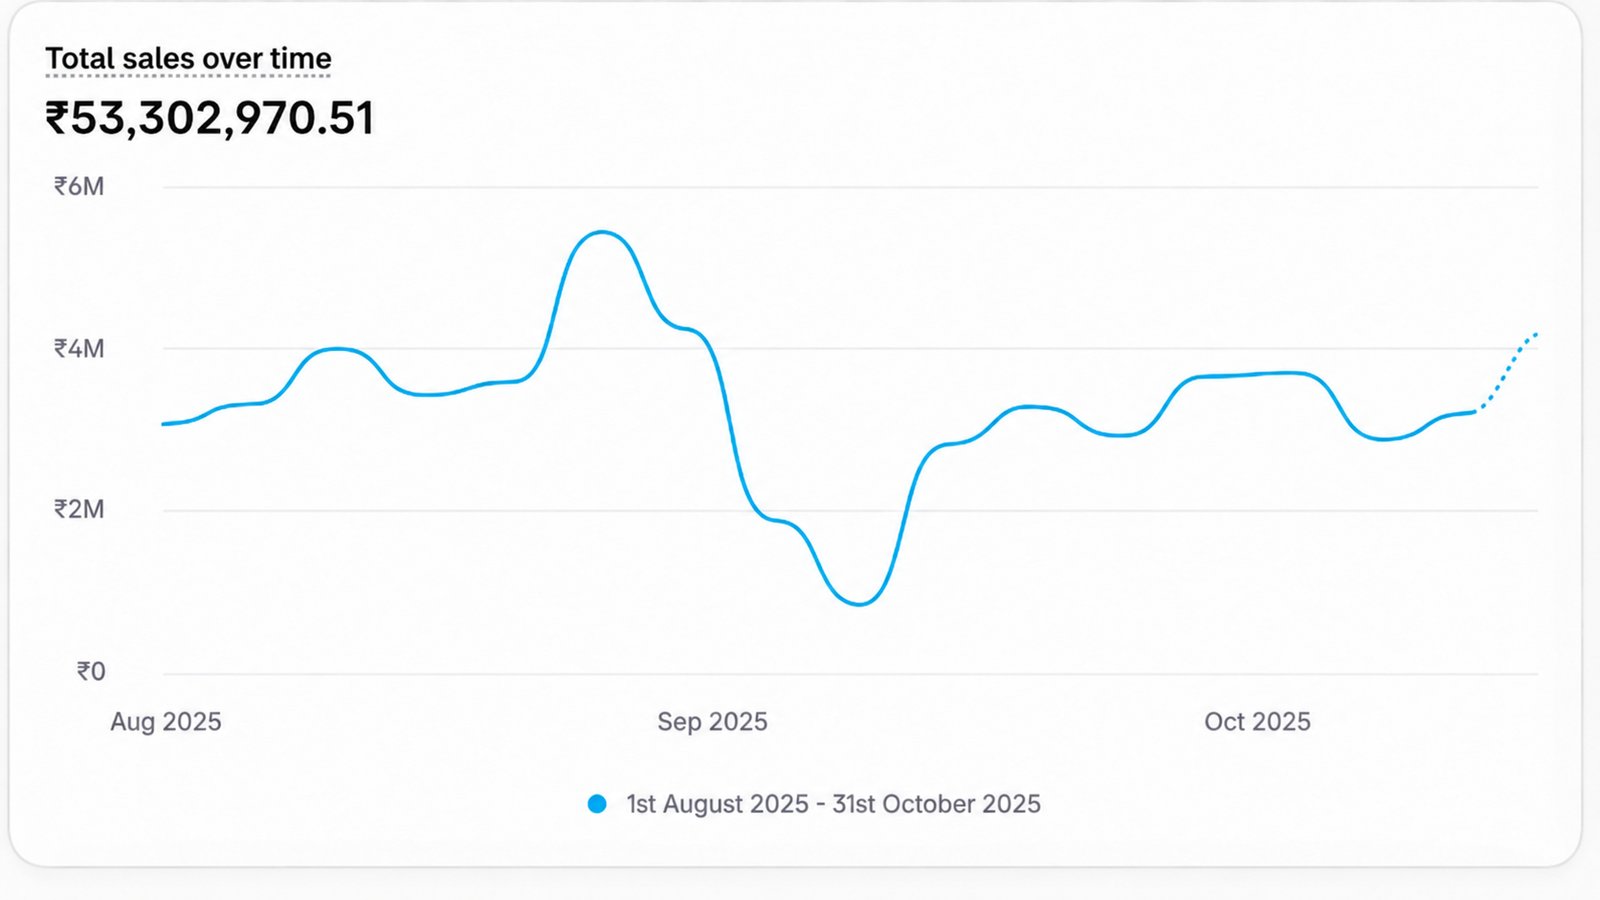
Fashion D2C Brand – Generated ₹5.33 Crores in Sales.
- Strong sales growth in August, with sales reaching a peak of approximately ₹5.3M.
- A significant sales dip in September, falling to around ₹1M.
- A strong recovery following the September decline.
- Sales stabilising at approximately ₹3M–₹3.8M through October.
- Total Sales: ₹5,33,02,970.51 (₹5.33 Crores)
- Reporting Period: August–October 2025
- Peak Monthly Sales Level: Approximately ₹53 lakh, based on the graph
- Recovery: Sales rebounded significantly after the September dip, returning to the ₹30–38 lakh range.
Consistent monitoring, strategic optimisation, and data-driven decisions are essential to navigating sales fluctuations and maintaining business growth.
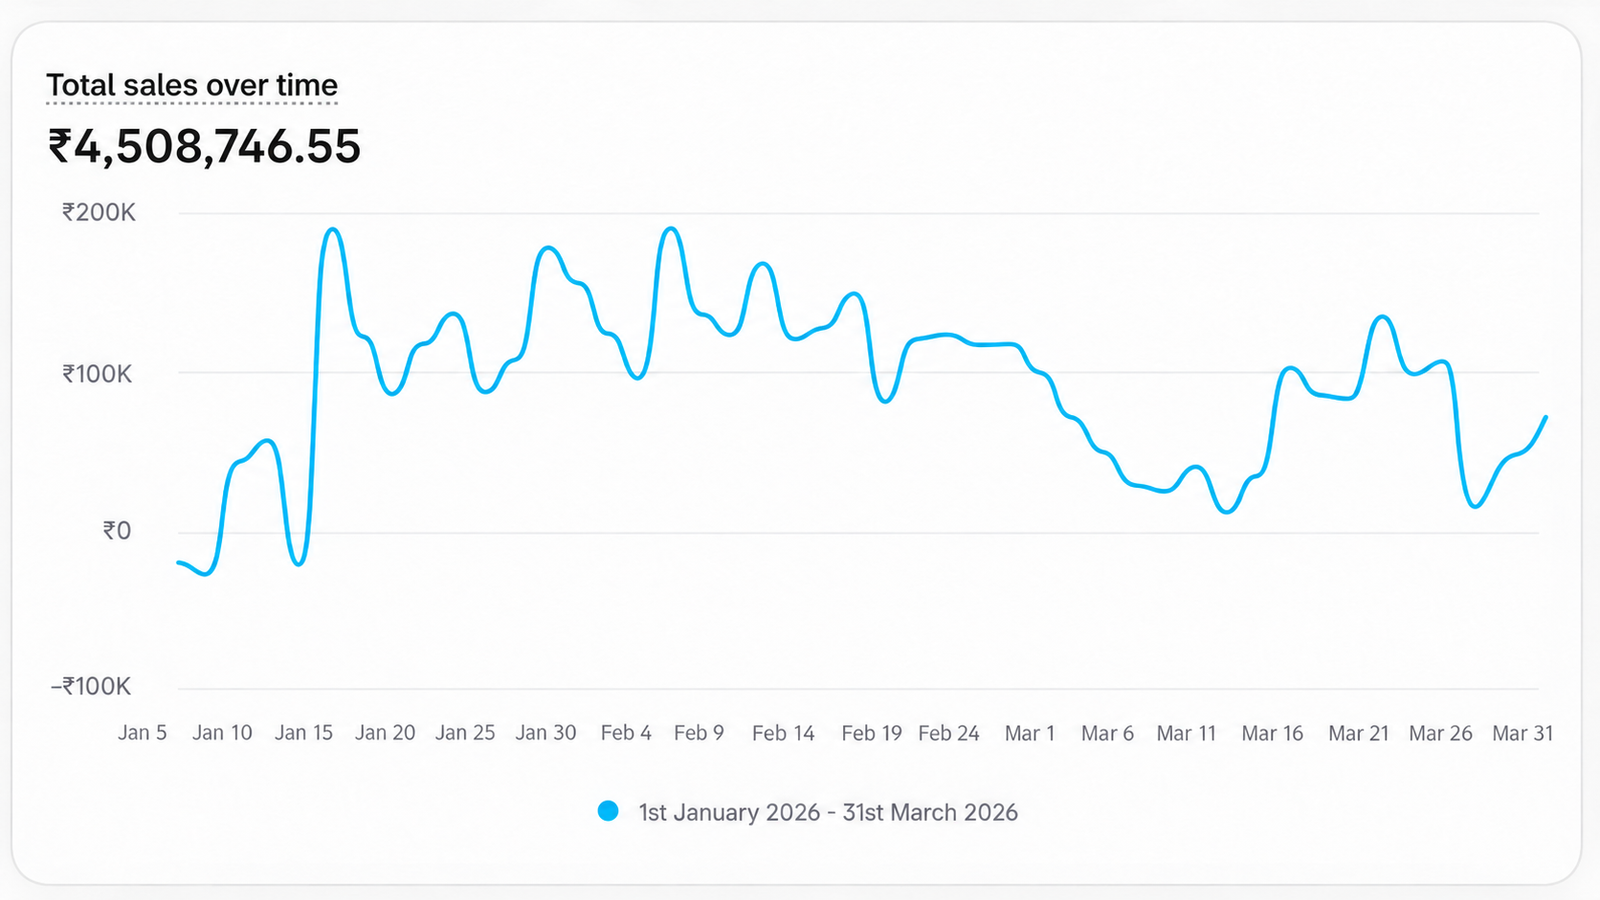
Footwear D2C Brand – Generated ₹45+ Lakhs in Sales in 3 Months.
- Maintaining consistent daily sales in a competitive footwear market
- Managing fluctuations in revenue throughout the sales cycle
- Identifying opportunities to improve conversions and maximise sales
- Building sustainable sales momentum through performance optimisation
About the Brand:
- Footwear D2C brand catering to online shoppers looking for stylish and comfortable footwear
Growth with Clicksi:
- Generated total sales of ₹45.08 Lakhs between January and March 2026
- Recorded multiple sales peaks exceeding ₹1.5 lakh in daily sales during January and February
- Maintained sales momentum through February, with several strong revenue days
- Navigated sales fluctuations in March, with a recovery in sales during the latter part of the month
Key Takeaway:
Consistent performance tracking and data-driven optimisation help identify sales opportunities and navigate fluctuations in a competitive D2C market.
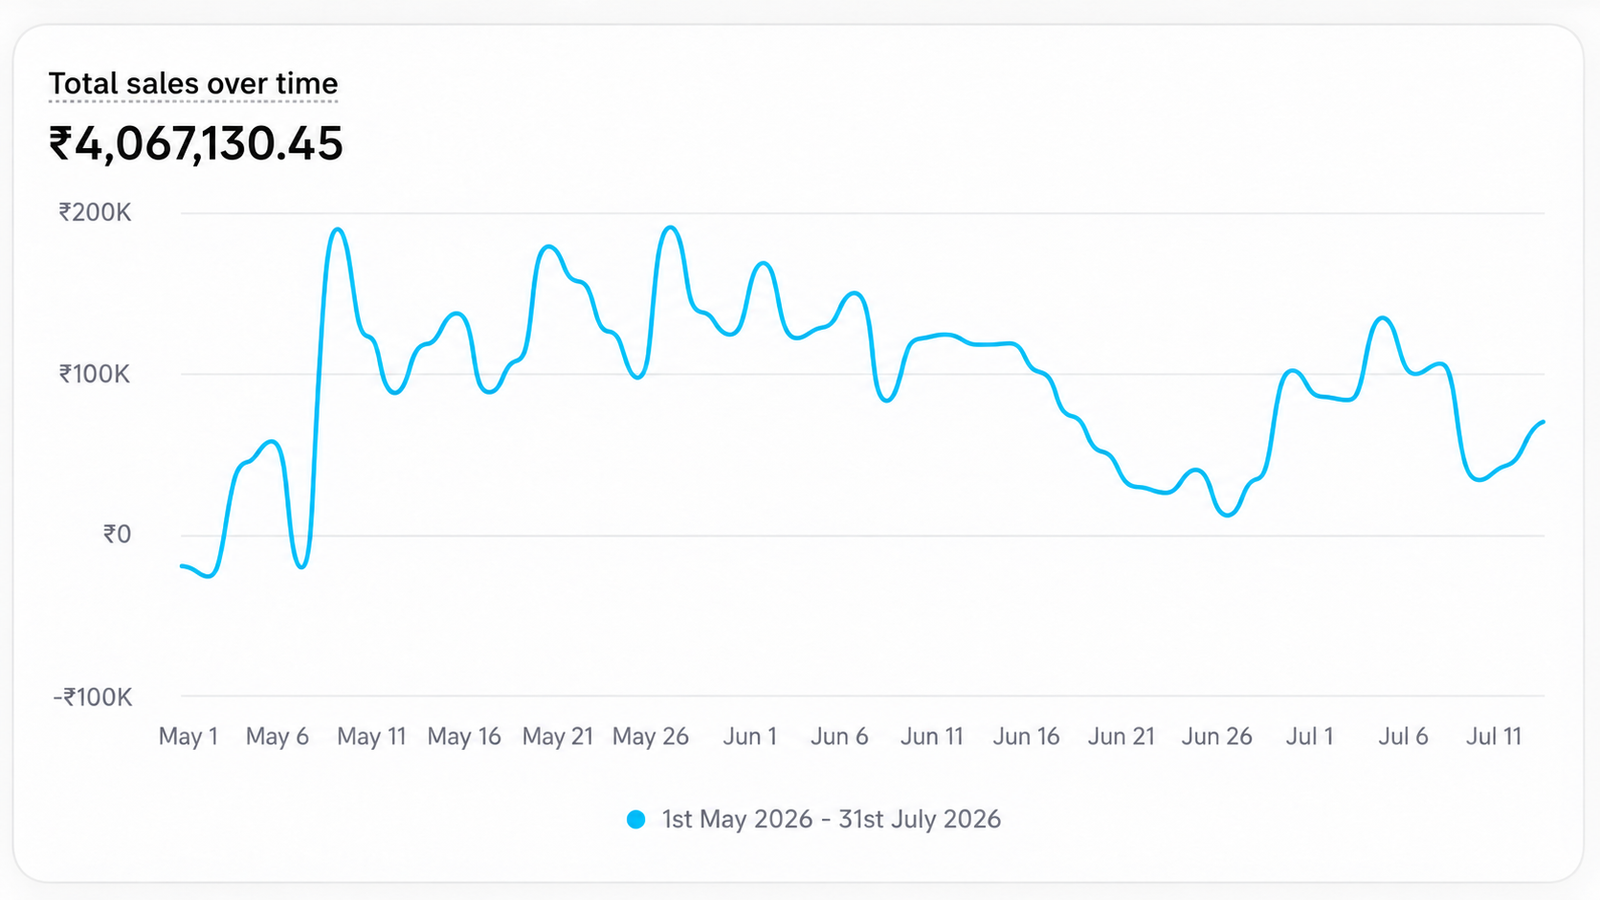
Jewellery D2C Brand – Generated ₹40.67 Lakhs in Sales in 3 Months
Problem Statement:
The brand was facing challenges in:
- Maintaining consistent sales performance in a competitive jewellery market
- Managing fluctuations in daily revenue
- Identifying opportunities to improve conversions and maximise sales
- Building sustainable sales momentum through performance optimisation
About the Brand:
- Jewellery brand catering to consumers looking for stylish and contemporary jewellery
Growth with Clicksi:
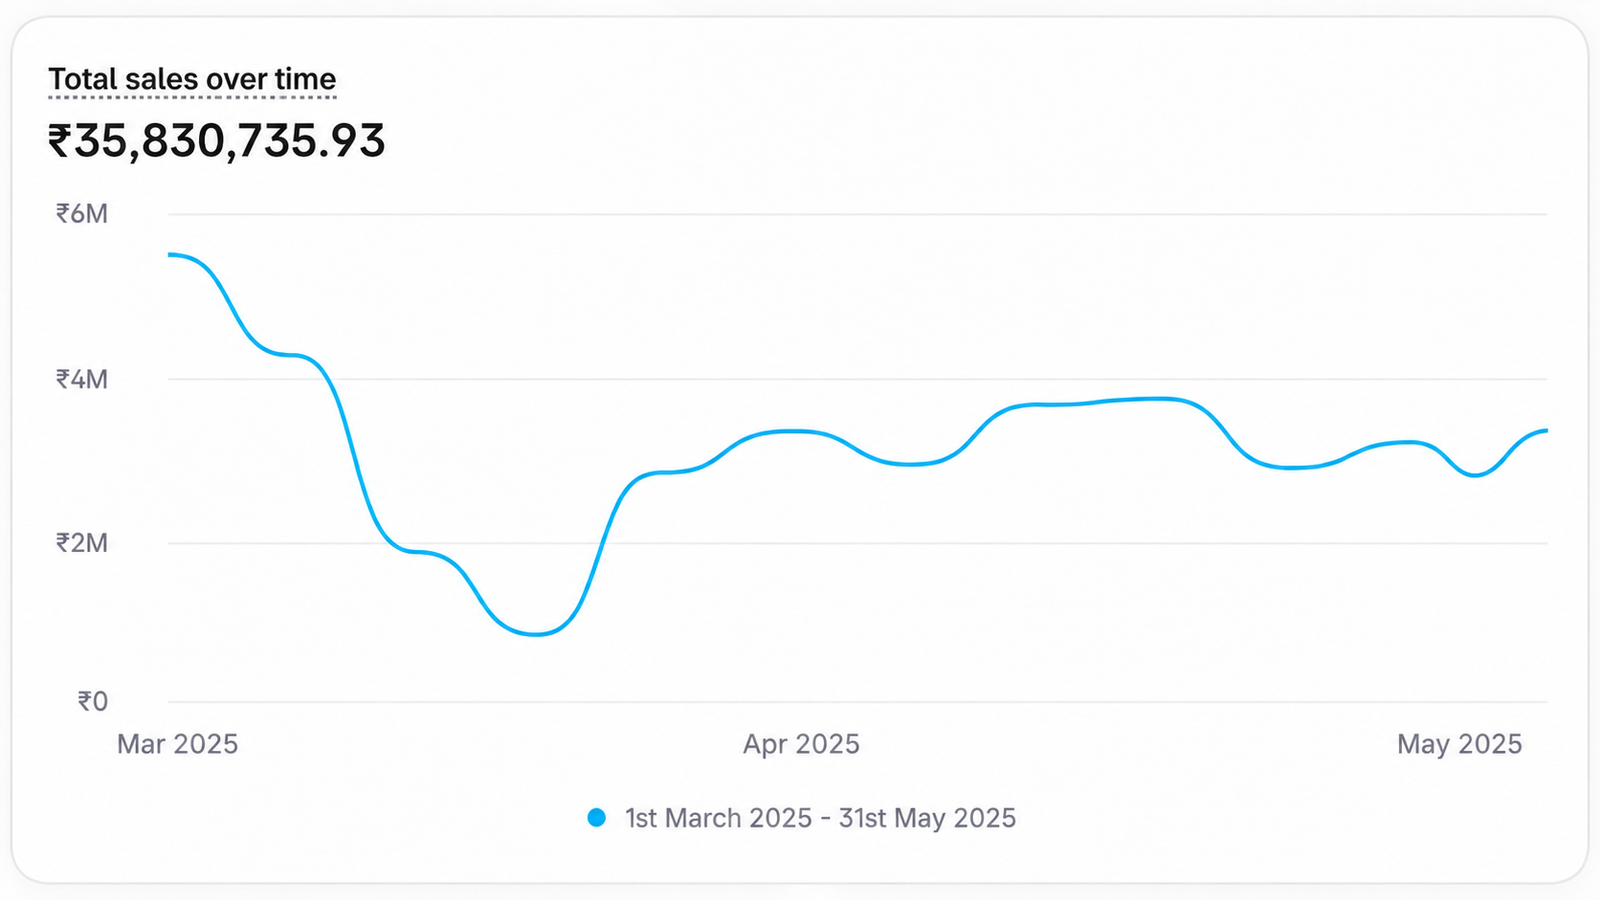
- Generated total sales of ₹40.67 Lakhs between May and July 2026
- Recorded multiple daily sales peaks exceeding ₹1.5 lakh during May
- Maintained strong sales momentum through May and early June
- Experienced sales fluctuations in late June, followed by a recovery in early July
- Ended the reporting period with sales recovering toward approximately ₹70,000 per day
Key Takeaway:
A data-driven approach to performance monitoring and optimisation helps identify growth opportunities and navigate sales fluctuations in the competitive jewellery market.
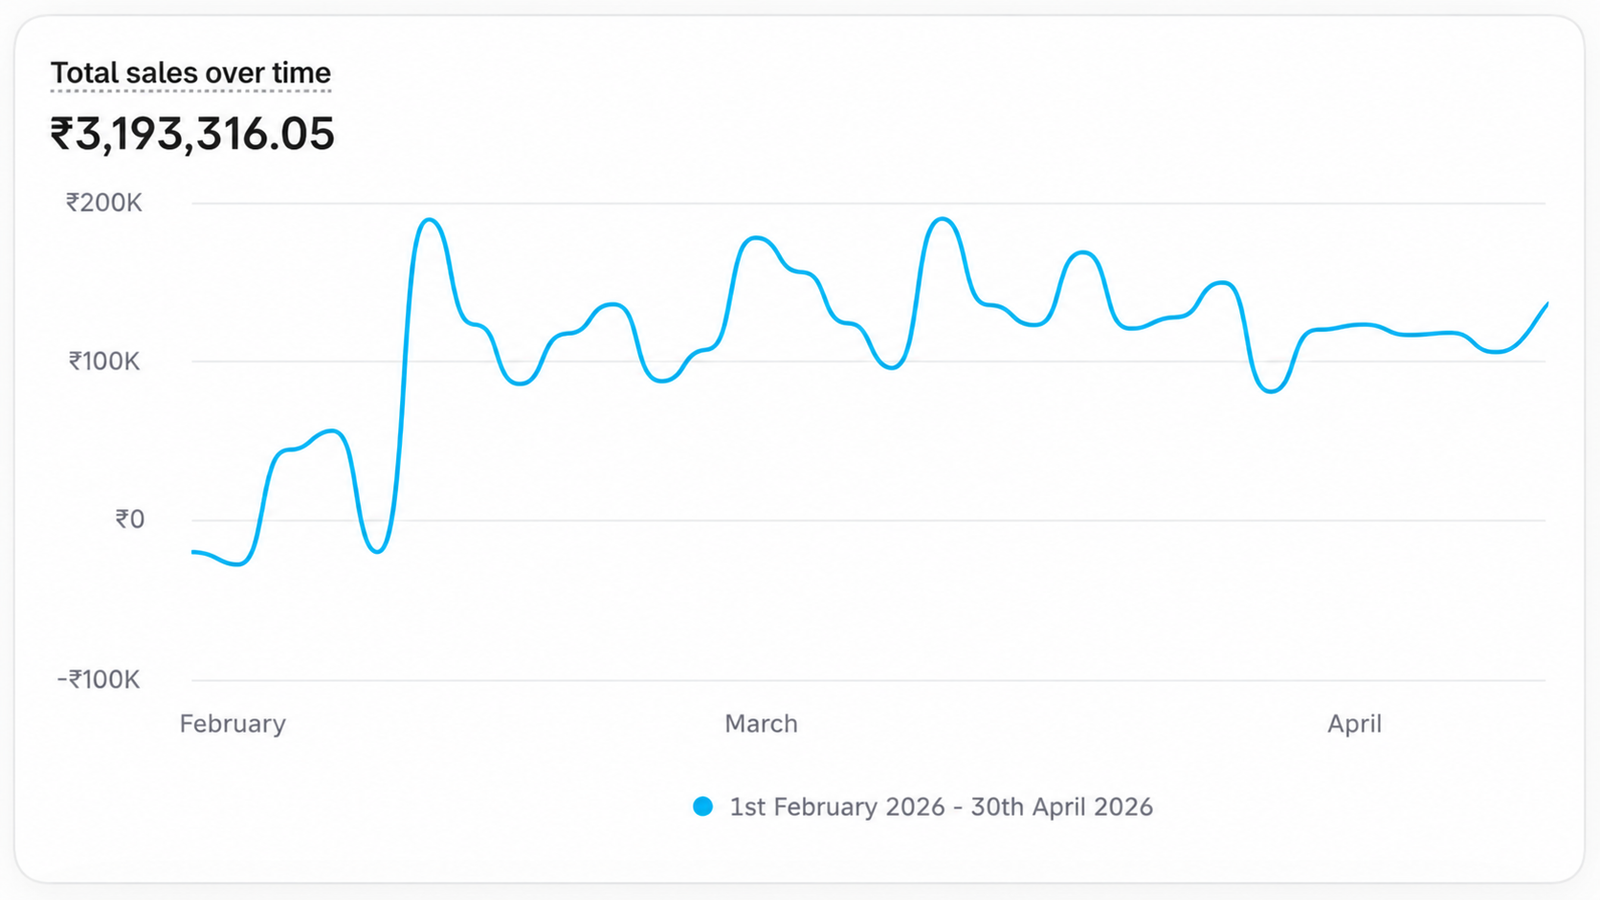
FMCG/CPG Brand — Generated ₹31.93 Lakhs in Sales in 3 Months
- Maintaining consistent sales performance in a competitive FMCG market
- Managing fluctuations in daily revenue
- Identifying opportunities to scale sales and improve conversions
- Building sustainable growth through performance optimisation
- FMCG/CPG brand focused on everyday consumer products with the potential for repeat purchases.
Growth with Clicksi:
- Generated total sales of ₹31.93 Lakhs between February and April 2026.
- Recorded a significant rise in daily sales during February, with multiple peaks exceeding ₹1.5 lakh.
- Maintained strong sales momentum throughout March, with daily sales frequently crossing ₹1 lakh.
- Sustained relatively stable daily sales in April, primarily within the ₹1–1.3 lakh range.
- Demonstrated consistent sales activity across the reporting period, despite short-term fluctuations.
A data-driven approach to performance monitoring and optimisation can help FMCG brands identify growth opportunities and build more consistent sales momentum.
Designed for D2C brands at a defined stage of growth
Clicksi is the right partner if you:
- Sell direct-to-consumer through your own Shopify storefront, with ₹10 lakh or more in monthly revenue
- Invest a minimum of ₹2 lakh per month in Meta advertising and intend to scale further
- Have established product-market fit and repeat purchase behaviour, but are seeing acquisition efficiency decline as spend increases
- Are prepared to share store data, margins and COGS so performance can be measured against real economics
Categories we know well:
Beauty and skincare
fashion and accessories
health and wellness
food and beverage
home and lifestyle
personal care
Clicksi is unlikely to be the right fit if you:
- are generating under ₹10 lakh in monthly revenue or investing under ₹2 lakh per month on Meta, sell primarily through marketplaces, or are looking for campaign management without accountability to business outcomes.
Questions we hear before the first call
Why do you use new customer MER instead of ROAS?
Platform ROAS includes any purchase the platform can attribute, including repeat customers and buyers who would have converted anyway. nMER measures first-time customer revenue against total marketing spend using store data. Once a brand passes ₹10L in monthly revenue, the difference between the two often determines whether growth is real.
How does nMER relate to blended MER?
Blended MER (aMER) measures total revenue against total spend and reflects overall efficiency. nMER isolates acquisition. We track both: a healthy aMER with a declining nMER usually means growth is relying on the existing customer base.
What is a good nMER for our brand?
There is no universal benchmark. Your target depends on gross margin, first-order AOV, repeat rate and cash position. We calculate your break-even nMER and a target range from your unit economics during the diagnostic.
How do you factor in profitability, not just revenue?
We report contribution margin at two levels: CM2 (after COGS, shipping, payment fees and returns) and CM3 (after marketing spend). Alongside CAC payback and cohort LTV:CAC, this shows whether growth is profitable now and how quickly acquisition spend is recovered.
Will platform ROAS fall when you take over?
It may, initially. Excluding existing customers and right-sizing retargeting often lowers platform ROAS while nMER, new customer revenue and CM3 improve. We report both views side by side so the trade-off is transparent.
How do you measure performance when attribution is unreliable?
We triangulate three sources: store-level new versus returning revenue, post-purchase attribution surveys, and controlled incrementality tests such as holdouts and geo experiments. Together they give a far more reliable view than any single attribution model.
How do you decide when to scale budgets?
We monitor marginal nMER, frequency and reach saturation weekly. Budgets increase only while the next tranche of spend remains above your nMER floor and keeps CM3 within target.
How much creative is required at this spend level?
Most brands spending ₹2L+/month on Meta need [8–20] new concepts per month to sustain acquisition. We lead creative strategy and production, and can work alongside your in-house design team or UGC creators. Every concept is assessed on hook rate, hold rate and contribution to nMER.
What happens if efficiency declines?
We pause further scaling and diagnose the cause, whether creative fatigue, audience saturation, offer, seasonality or site conversion, and share findings and a corrective plan within the week.
What access do you need?
Access to your Meta ad accounts, store analytics (Shopify or equivalent), GA4, and visibility of margins, COGS and fulfilment costs. Without margin data, profitability cannot be measured accurately.
We already have an in-house team or agency. How would this work?
We can take full ownership of paid media, or partner with your team on measurement, creative strategy and testing. Most engagements begin with a diagnostic, so you can evaluate our thinking before committing.
Is there a minimum commitment?
We recommend an initial [3-month] engagement. Restructuring accounts, building measurement and running incrementality tests require that time to produce reliable conclusions. Thereafter, the engagement continues month to month.
- For D2C brands with ₹10L+ monthly revenue and ₹2L+/month Meta spend. We respond within 24 hours, typically with a few focused questions of our own.